The On-Board Diagnostics II (OBD2) system has revolutionized vehicle maintenance and repair. Acting as your car’s nervous system, it constantly monitors various parameters, providing a wealth of real-time information about its health and performance. For car owners and professional technicians alike, understanding How To Read Obd2 Live Data is an invaluable skill. It’s the key to unlocking deeper insights into your vehicle, enabling proactive maintenance, accurate diagnoses, and even performance optimization. This comprehensive guide will demystify OBD2 live data, empowering you to access and interpret this critical information effectively.
Navigating the World of OBD2: A Quick History Lesson
Before the sophistication of OBD2, there was OBD1. This earlier system was a more basic diagnostic tool, primarily focused on emissions-related issues. The transition to OBD2 was a monumental leap forward. Driven by stricter environmental regulations and the increasing complexity of vehicle systems, OBD2 brought standardization to the automotive diagnostic landscape. It introduced universal diagnostic trouble codes (DTCs) and, crucially, real-time data monitoring capabilities. This evolution made vehicle diagnostics more accessible, standardized, and significantly more informative, benefiting both mechanics and vehicle owners.
Understanding the Essence of OBD2 Live Data
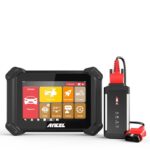
Alt text: A handheld OBD2 scanner displaying real-time vehicle data on its screen, highlighting the ‘Live Data’ function within the menu.
OBD2 live data is precisely what it sounds like: a continuous stream of information broadcasted by your vehicle’s engine control unit (ECU) and other onboard computer systems. It’s a dynamic, real-time window into your car’s inner workings, displaying actual sensor readings and system statuses as they change. Instead of relying solely on stored error codes, live data allows you to observe your vehicle’s behavior in real-time, under various operating conditions. This dynamic view is essential for diagnosing intermittent issues, understanding system interactions, and verifying the effectiveness of repairs or adjustments as they are made.
Key Parameters You’ll Encounter in OBD2 Live Data
When you access OBD2 live data, you’ll be presented with a list of parameters, each providing a specific piece of information about your vehicle’s operation. Here are some of the most common and crucial parameters to understand:
- Engine RPM (Revolutions Per Minute): This measures how fast your engine’s crankshaft is rotating. It’s a fundamental indicator of engine speed and load.
- Vehicle Speed: Self-explanatory, this parameter displays your car’s current speed, as measured by the vehicle speed sensor.
- Throttle Position: Expressed as a percentage, this indicates how far open the throttle valve is. It reflects driver input and the amount of air being allowed into the engine.
- Fuel System Status: This parameter provides information on the operational mode of the fuel system, such as open loop, closed loop, or fault conditions.
- Short Term and Long Term Fuel Trim (STFT & LTFT): These values represent the adjustments the ECU is making to the fuel mixture to maintain the ideal air-fuel ratio. They can indicate fuel system issues, vacuum leaks, or sensor problems.
- Oxygen Sensor Data (O2 Sensor Readings): Readings from the oxygen sensors in the exhaust system are vital for monitoring the air-fuel mixture and the efficiency of the catalytic converter.
- Coolant Temperature: This parameter shows the engine coolant temperature, crucial for monitoring engine operating temperature and preventing overheating.
- Intake Air Temperature (IAT): The temperature of the air entering the intake manifold. IAT affects air density and engine performance.
- Manifold Absolute Pressure (MAP): Measures the pressure in the intake manifold. MAP readings are related to engine load and vacuum.
- Battery Voltage: Displays the voltage of the vehicle’s battery, essential for monitoring the health of the charging system.
Unlocking the Power: Benefits of Reading OBD2 Live Data
Accessing and understanding OBD2 live data offers a multitude of advantages for vehicle owners and technicians:
- Real-Time Performance Insights: Live data provides immediate feedback, allowing you to see the direct impact of adjustments or repairs on your vehicle’s performance. You can monitor changes as they happen, making diagnostics more dynamic and effective.
- Proactive Preventative Maintenance: By regularly monitoring live data parameters, you can detect subtle anomalies or deviations from normal readings before they escalate into major problems. This early detection is key to preventative maintenance and avoiding costly repairs down the line.
- Performance Optimization and Tuning: For car enthusiasts and performance tuners, live data is indispensable. It provides the detailed information needed to optimize engine performance, improve fuel efficiency, and fine-tune various engine parameters for desired results.
- Emissions Compliance Verification: Live data, particularly oxygen sensor readings and fuel trim values, can be used to ensure your vehicle is operating within emission standards. This is crucial for passing emissions tests and maintaining environmental compliance.
- Enhanced Diagnostic Accuracy: Live data complements diagnostic trouble codes (DTCs). By observing live parameters in conjunction with DTCs, you can gain a more complete picture of the issue, leading to more accurate diagnoses and effective repairs.
Tools of the Trade: Accessing OBD2 Live Data
To tap into the stream of OBD2 live data, you’ll need the right tools. Fortunately, a variety of options are available, catering to different needs and budgets:
- Handheld OBD2 Scanners: These are portable, dedicated devices designed specifically for reading OBD2 data. They plug directly into your vehicle’s OBD2 port and display live data on their built-in screens. They range from basic code readers to more advanced scanners with graphing and data logging capabilities.
- Smartphone Apps with OBD2 Bluetooth Adapters: This is a popular and versatile option. Wireless OBD2 adapters plug into your car’s OBD2 port and communicate with smartphone apps via Bluetooth. These apps offer user-friendly interfaces to view, record, and analyze live data on your smartphone or tablet.
- Professional Diagnostic Scan Tools: These are high-end, sophisticated tools used by professional mechanics. They offer the most comprehensive features, including detailed live data analysis, bi-directional controls, advanced testing capabilities, and manufacturer-specific diagnostics.
Choosing the right tool depends on your needs and technical expertise. For basic diagnostics and monitoring, a handheld scanner or smartphone app may suffice. For advanced diagnostics and professional use, a dedicated professional scan tool is typically required.
Getting Hands-On: Essential Tools for Reading OBD2 Live Data
To start reading OBD2 live data, you’ll need an OBD2 scanner or reader. A reliable option is the GaragePro OBD scan tool, known for its user-friendliness and comprehensive features.
Step-by-Step: Setting Up Your OBD2 Reader for Live Data
Connecting an OBD2 reader to your vehicle is generally a simple process:
- Locate the OBD2 Port: The OBD2 port is typically located under the dashboard on the driver’s side. Consult your vehicle’s owner’s manual if you’re unsure of its exact location.
- Plug in the Reader: With the ignition off, plug your OBD2 scanner or adapter securely into the OBD2 port.
- Turn on the Ignition (Key to “ON” position, engine off): Turn the ignition key to the “ON” position without starting the engine. This powers up the vehicle’s electrical systems and the OBD2 port.
- Power Up the Scanner: Most handheld scanners will power on automatically once connected. For Bluetooth adapters, ensure they are paired with your smartphone or tablet and the app is running.
- Navigate to Live Data: Using the scanner’s interface or the smartphone app, navigate to the “Live Data” or “Real-Time Data” section. The exact menu names may vary slightly depending on your tool.
If you encounter connection problems, double-check that the tool is compatible with your vehicle’s make and model. Ensure the connection to the OBD2 port is secure, and consult the tool’s manual for troubleshooting tips.
Mastering the Interface: Navigating Your OBD2 Scanner
Once connected, understanding the OBD2 scanner interface is key to effectively accessing and utilizing live data.
Basic Navigation Essentials
- Powering Up: As mentioned, most scanners power on automatically when connected to the OBD2 port.
- Main Menu Exploration: Upon startup, you’ll typically be presented with a main menu. Common options usually include “Read Codes,” “Erase Codes,” “Live Data,” “Freeze Frame,” and “Vehicle Information.”
- “Read Codes” Function: This option allows you to retrieve diagnostic trouble codes (DTCs) stored in the vehicle’s computer memory. DTCs are codes that pinpoint detected issues within various vehicle systems.
- “Erase Codes” Function: After you’ve diagnosed and resolved a problem, the “Erase Codes” function allows you to clear the stored DTCs and turn off the check engine light.
- “Live Data” Function: This is your gateway to real-time vehicle information. Selecting “Live Data” will display a stream of parameters being measured by various sensors and systems.
- “Freeze Frame” Data: This valuable feature captures a snapshot of vehicle data at the precise moment a fault code is triggered. Freeze frame data provides crucial context and can be very helpful in diagnosing intermittent or elusive problems.
Stepping Up: Advanced Features for Deeper Diagnostics
- Graphing and Data Logging: Many advanced scanners offer graphing capabilities, allowing you to visualize live data parameters over time. This is incredibly useful for identifying trends, patterns, or intermittent glitches in sensor readings. Data logging enables you to record live data for later analysis, which is invaluable for diagnosing driveability issues that occur under specific conditions.
- Advanced Diagnostic Tests: More sophisticated tools may offer additional diagnostic tests beyond basic code reading and live data. These can include oxygen sensor tests, EVAP system tests, misfire monitoring, and component activation tests.
- Manufacturer-Specific Data: Some advanced scanners can access manufacturer-specific diagnostic codes and data parameters beyond the standard OBD2 protocols. This provides a deeper level of diagnostic capability for specific vehicle brands.
Pro Tips for Navigating the OBD2 Interface
- Read the Manual First: Different OBD2 scanners have varying interfaces and functionalities. Take the time to familiarize yourself with your scanner’s user manual to understand its specific features and navigation.
- Start with the Basics: Begin by mastering the fundamental functions like reading and clearing codes before venturing into more advanced features like graphing or bi-directional controls.
- Document Codes and Data: Before clearing any DTCs, always record the codes and any associated freeze frame data. This information can be crucial for future reference and further diagnosis if the issue recurs.
- Safety Always Comes First: When performing diagnostics, especially when using live data or conducting tests that require the engine to be running, prioritize safety. Ensure the vehicle is parked in a well-ventilated area, the parking brake is engaged, and you are aware of your surroundings.
- Continuous Learning is Key: Automotive technology is constantly evolving, and so are OBD2 systems. Stay updated on new features, functionalities, and diagnostic techniques to maximize the effectiveness of your OBD2 tools.
Navigating an OBD2 interface may initially seem intimidating, but with practice and exploration, it becomes a powerful asset in vehicle diagnostics and maintenance. Whether you are a seasoned mechanic or a DIY enthusiast, mastering your OBD2 scanner can significantly enhance your understanding of modern automotive technology and your ability to maintain and repair vehicles effectively.
Decoding the Data Stream: Interpreting Live Data Readouts
Interpreting OBD2 live data is the crucial step in turning raw data into actionable diagnostic information. Here’s a guide to understanding common live data parameters and how to interpret them:
Key Live Data Parameters for Interpretation
- Engine RPM: While idling, RPM should be within the manufacturer’s specified range (typically 600-1000 RPM). Unusually high or low RPM can indicate idle control problems, vacuum leaks, or other engine issues.
- Vehicle Speed: Verify speedometer accuracy by comparing live data speed with the speedometer reading. Discrepancies can point to speed sensor or instrument cluster problems.
- Throttle Position: At idle, throttle position should typically be close to 0%. During acceleration, it should increase smoothly and proportionally to pedal input. Erratic or unresponsive throttle position readings can indicate throttle position sensor (TPS) issues.
- Oxygen Sensor Data: Oxygen sensor readings fluctuate rapidly in closed-loop operation, indicating the ECU is actively adjusting the air-fuel mixture. Stagnant or consistently high/low readings can suggest sensor malfunctions, air-fuel ratio problems, or catalytic converter issues.
- Fuel System Status: In closed-loop operation, the fuel system status should indicate that the ECU is using oxygen sensor feedback to regulate fuel delivery. Open-loop operation at normal operating temperature can indicate sensor failures or system faults.
- Intake Air and Coolant Temperature: Compare these readings to ambient temperature and expected engine operating temperature. Abnormally high coolant temperature indicates potential overheating. IAT sensor readings that are drastically different from ambient temperature can indicate sensor problems.
- Manifold Absolute Pressure (MAP): At idle, MAP readings should typically be low, indicating engine vacuum. High MAP readings at idle can suggest vacuum leaks or sensor issues. During acceleration, MAP readings should increase.
Essential Tips for Effective Data Interpretation
- Establish a Baseline: Know Normal Ranges: Familiarize yourself with the typical operating ranges for live data parameters for your specific vehicle make and model. This baseline knowledge is crucial for identifying deviations and anomalies. Consult your vehicle’s service manual or reliable online resources for specifications.
- Correlate Data with Symptoms: Don’t analyze live data in isolation. Relate unusual readings to the specific symptoms or drivability issues your vehicle is exhibiting. This correlation helps narrow down the potential causes and focus your diagnostic efforts. For example, high fuel trims combined with a lean running symptom might point to a vacuum leak.
- Leverage Graphical Displays: If your OBD2 scanner offers graphing capabilities, use them! Visualizing data trends over time can reveal subtle anomalies and intermittent issues that might be missed by looking at static data points.
- Monitor Data Under Varying Conditions: Observe how live data parameters change under different driving conditions – idle, acceleration, cruising, deceleration. This dynamic analysis can provide valuable insights into system performance under load and different operating modes.
- Cross-Reference with DTCs: Use diagnostic trouble codes (DTCs) as a starting point and complement your analysis with live data. DTCs provide a general indication of the problem area, while live data helps pinpoint the specific component or system malfunction.
Practical Applications of Live Data Interpretation
- Fuel Efficiency Diagnostics: Analyze oxygen sensor readings, fuel trims, and MAP sensor data to identify factors affecting fuel economy, such as rich or lean running conditions, vacuum leaks, or inefficient combustion.
- Engine Performance Troubleshooting: Focus on parameters like throttle position, RPM, MAP, and ignition timing to diagnose engine performance issues like sluggish acceleration, misfires, or rough idling.
- Emissions System Diagnostics: Pay close attention to oxygen sensor data, catalytic converter efficiency readings (if available), and fuel trim values when diagnosing emission-related problems.
Effective live data interpretation requires a solid understanding of vehicle systems, sensor operation, and how different parameters interact. The more you practice and familiarize yourself with live data analysis, the more proficient you will become at diagnosing vehicle issues accurately and efficiently.
Deep Dive: Common OBD2 Live Data Parameters Explained
Let’s delve deeper into some of the most frequently encountered OBD2 live data parameters and understand their significance in vehicle diagnostics:
1. Engine RPM (Revolutions Per Minute)
- Detailed Explanation: Engine RPM is a measure of how many times the engine’s crankshaft completes a full rotation in one minute. It’s a fundamental indicator of engine speed and load.
- Diagnostic Significance:
- High RPM at Idle: Can indicate vacuum leaks, idle air control (IAC) valve malfunctions, or throttle body issues.
- Low RPM at Idle: May suggest engine misfires, low compression, or issues with the IAC system.
- Erratic RPM: Can be a symptom of misfires, ignition problems, or sensor malfunctions.
2. Vehicle Speed
- Detailed Explanation: Vehicle speed is the speed at which the vehicle is traveling, typically measured in miles per hour (MPH) or kilometers per hour (km/h). It’s derived from the vehicle speed sensor (VSS).
- Diagnostic Significance:
- Speedometer Inaccuracy: Compare live data speed to the speedometer reading. Discrepancies can indicate speedometer calibration issues, VSS problems, or instrument cluster faults.
- ABS/Traction Control Issues: Vehicle speed data is crucial for ABS and traction control systems. Incorrect VSS readings can trigger ABS or traction control warning lights.
3. Throttle Position
- Detailed Explanation: Throttle position indicates the opening angle of the throttle body valve, which controls the amount of air entering the engine. It’s measured by the throttle position sensor (TPS).
- Diagnostic Significance:
- Sticking Throttle: Check for smooth and proportional changes in throttle position as you press and release the accelerator pedal. Jerky or non-linear readings can indicate a sticking throttle body or TPS issues.
- Idle Control Problems: Incorrect TPS readings can affect idle control and cause high or erratic idle speeds.
- Acceleration Issues: A faulty TPS can lead to poor acceleration, hesitation, or lack of power.
4. Oxygen Sensor Data
- Detailed Explanation: Oxygen sensors (O2 sensors) measure the amount of oxygen in the exhaust gas. They are critical for monitoring the air-fuel mixture and ensuring efficient combustion and low emissions. Modern vehicles typically have multiple O2 sensors – upstream sensors before the catalytic converter and downstream sensors after it.
- Diagnostic Significance:
- Upstream Sensor Readings: Should fluctuate rapidly between rich (low voltage) and lean (high voltage) in closed-loop operation. Slow response or stagnant readings can indicate sensor aging or contamination.
- Downstream Sensor Readings: Should be more stable compared to upstream sensors, indicating the catalytic converter is effectively reducing pollutants. Erratic downstream sensor readings can suggest catalytic converter inefficiency.
- Lean or Rich Conditions: Consistently lean readings (high voltage) can point to lean fuel mixture issues (vacuum leaks, fuel delivery problems). Consistently rich readings (low voltage) can indicate rich fuel mixture problems (fuel injector leaks, faulty pressure regulator).
5. Fuel System Status
- Detailed Explanation: This parameter indicates the operational mode of the fuel system. Common statuses include:
- Open Loop: The ECU is not using oxygen sensor feedback to adjust the air-fuel mixture. This typically occurs during engine warm-up or under heavy load.
- Closed Loop: The ECU is actively using oxygen sensor feedback to fine-tune the air-fuel mixture for optimal combustion and emissions.
- Fault Conditions: Indicates a problem within the fuel system, such as sensor failures or system malfunctions.
- Diagnostic Significance:
- Stuck in Open Loop: If the fuel system remains in open loop even after the engine is warmed up, it can indicate issues with oxygen sensors, coolant temperature sensor, or other components that prevent closed-loop operation.
6. Intake Air Temperature (IAT)
- Detailed Explanation: IAT sensor measures the temperature of the air entering the intake manifold. Air density is affected by temperature; colder air is denser and contains more oxygen, which affects engine performance.
- Diagnostic Significance:
- High IAT Readings: Can indicate a hot engine compartment, restricted airflow to the intake, or a faulty IAT sensor. High IAT can reduce engine power and fuel efficiency.
- Low IAT Readings: May indicate a faulty IAT sensor or unusually cold ambient conditions.
7. Coolant Temperature
- Detailed Explanation: Coolant temperature sensor measures the temperature of the engine coolant. It’s critical for monitoring engine operating temperature and preventing overheating.
- Diagnostic Significance:
- Overheating: High coolant temperature readings indicate engine overheating, which can cause severe engine damage. Investigate cooling system issues immediately.
- Thermostat Problems: Slow warm-up or fluctuating coolant temperature can indicate thermostat malfunctions.
- Sensor Faults: Erratic or implausible coolant temperature readings can point to a faulty coolant temperature sensor.
8. Manifold Absolute Pressure (MAP)
- Detailed Explanation: MAP sensor measures the absolute pressure in the intake manifold. It’s related to engine load and vacuum.
- Diagnostic Significance:
- Vacuum Leaks: High MAP readings at idle (closer to atmospheric pressure) indicate vacuum leaks, which can cause lean running conditions and idle problems.
- Sensor Malfunctions: Implausible or erratic MAP readings can point to a faulty MAP sensor.
- Engine Load Assessment: MAP readings increase with engine load (acceleration) and decrease during deceleration.
9. Short Term and Long Term Fuel Trim (STFT & LTFT)
- Detailed Explanation: Fuel trims represent the percentage adjustments the ECU makes to the base fuel mixture to maintain the ideal air-fuel ratio (stoichiometric ratio).
- Short Term Fuel Trim (STFT): Represents immediate, dynamic adjustments made by the ECU based on real-time oxygen sensor feedback.
- Long Term Fuel Trim (LTFT): Represents learned, adaptive adjustments made over time to compensate for consistent deviations in the fuel mixture.
- Diagnostic Significance:
- Positive Fuel Trims (e.g., +10% or higher): Indicate a lean running condition (too much air, not enough fuel). Possible causes include vacuum leaks, fuel delivery problems (weak fuel pump, clogged fuel filter, injector issues), or sensor malfunctions.
- Negative Fuel Trims (e.g., -10% or lower): Indicate a rich running condition (too much fuel, not enough air). Possible causes include fuel injector leaks, high fuel pressure, restricted air intake, or sensor malfunctions.
- Large Fuel Trim Values: Significantly high or low fuel trim values indicate a substantial air-fuel ratio imbalance that needs to be investigated.
10. Battery Voltage
- Detailed Explanation: Battery voltage reading displays the voltage of the vehicle’s battery.
- Diagnostic Significance:
- Low Voltage (below 12V with engine off, below 13.5V with engine running): Indicates a weak battery, charging system problems (alternator issues), or excessive electrical drain.
- Overcharging (above 15V with engine running): Can indicate voltage regulator problems in the alternator, which can damage the battery and electrical components.
Understanding these common OBD2 live data parameters and their typical ranges is essential for effective vehicle diagnostics. By monitoring these parameters and interpreting their readings in context, you can gain valuable insights into your vehicle’s health and performance.
Unleashing Advanced Capabilities: Advanced Features in OBD2 Live Data Reading
Moving beyond basic data display, advanced OBD2 live data reading features offer even more powerful diagnostic and analytical capabilities. These features are particularly valuable for troubleshooting complex issues and gaining a deeper understanding of vehicle system interactions.
1. Real-Time Graphing
- Functionality: Advanced scanners and software can display live data parameters in graphical form, plotting values over time.
- Diagnostic Utility: Graphing is invaluable for visualizing dynamic data changes, identifying trends, and spotting intermittent problems that may not be apparent in static numerical data. For example, graphing oxygen sensor readings can reveal slow sensor response or erratic fluctuations.
2. Mode 6 Testing (On-Board Monitoring Test Results)
- Functionality: OBD2 Mode 6 provides access to on-board diagnostic monitoring test results for various emission-related components and systems. These tests are often more detailed than standard DTCs and can reveal issues before they trigger a check engine light.
- Diagnostic Utility: Mode 6 data can be used for preemptive maintenance, identifying potential problems early, and diagnosing subtle component malfunctions that don’t generate standard fault codes. It’s particularly useful for diagnosing issues with catalytic converters, oxygen sensors, evaporative emission (EVAP) systems, and misfire monitoring.
3. Fuel System Monitoring (Advanced)
- Functionality: Beyond basic fuel system status and fuel trims, advanced OBD2 tools can provide more detailed fuel system data, such as fuel pressure readings, fuel injector pulse width (injector on-time), and injector balance rates (for diesel engines).
- Diagnostic Utility: This advanced fuel system data is crucial for diagnosing complex fuel delivery problems, injector malfunctions, fuel pump issues, and fuel pressure regulator failures.
4. Advanced Emission Readings
- Functionality: Advanced emission readings may include data on catalytic converter efficiency, EGR (Exhaust Gas Recirculation) system performance, and EVAP system parameters beyond basic DTCs.
- Diagnostic Utility: These advanced emission readings are vital for ensuring vehicles meet emission standards and for diagnosing complex emission-related problems that may not be readily apparent from standard fault codes.
5. Boost Pressure Monitoring (Turbocharged Engines)
- Functionality: For turbocharged or supercharged vehicles, advanced OBD2 tools can monitor boost pressure (manifold pressure above atmospheric pressure).
- Diagnostic Utility: Boost pressure data is essential for diagnosing turbocharger or supercharger performance issues, boost leaks, and problems with related control systems.
6. Bi-Directional Control (Actuator Tests)
- Functionality: Bi-directional control allows the scanner to send commands to the vehicle’s ECU to activate or control specific components or systems.
- Diagnostic Utility: Bi-directional control enables active component testing. For example, you can use it to cycle the A/C compressor clutch, activate the fuel pump, test individual fuel injectors, or control EGR valve operation. This allows you to isolate component malfunctions and verify system functionality.
7. Customizable Data Points (PIDs Selection)
- Functionality: Advanced OBD2 software allows users to customize the data parameters (PIDs – Parameter IDs) they want to monitor. You can select specific parameters relevant to the diagnostic task at hand, rather than being limited to a pre-defined list.
- Diagnostic Utility: Customizable data point selection provides targeted diagnostics. You can focus on the parameters most relevant to the system or component you are investigating, streamlining data analysis and reducing information overload.
8. Transmission Data Monitoring
- Functionality: Advanced OBD2 tools can access and display live data from the vehicle’s transmission control module (TCM), providing insights into transmission operation.
- Diagnostic Utility: Transmission data monitoring is crucial for diagnosing automatic transmission problems, such as shift issues, slipping, or torque converter malfunctions. Parameters may include transmission fluid temperature, gear selection, torque converter slip, and solenoid activation status.
9. ABS and Airbag System Diagnostics (Limited)
- Functionality: Some advanced OBD2 scanners can read diagnostic codes and limited live data from ABS (Anti-lock Braking System) and airbag (Supplemental Restraint System – SRS) systems. However, full diagnostics of these safety-critical systems often requires specialized scan tools.
- Diagnostic Utility: Basic ABS and SRS diagnostics through OBD2 can help identify general problems within these systems, but for comprehensive troubleshooting, manufacturer-specific or professional-grade scan tools are typically needed.
10. PID (Parameter ID) Data (Raw Sensor Data)
- Functionality: Access to raw PID data provides direct access to sensor readings and ECU calculations.
- Diagnostic Utility: PID data is useful for in-depth analysis of engine operation and for diagnosing complex or intermittent issues that standard DTCs may not reveal. It allows experienced technicians to delve into the inner workings of the engine management system.
Leveraging these advanced OBD2 features requires a more sophisticated scanner, specialized software, and a deeper understanding of vehicle systems. However, for professional mechanics and serious DIY enthusiasts, these capabilities are invaluable for comprehensive diagnostics, performance optimization, and tackling complex automotive problems.
Troubleshooting Common OBD2 Live Data Issues: Quick Fixes
Even with the best tools, you might encounter issues when trying to read OBD2 live data. Here are some troubleshooting tips to resolve common problems:
- Verify OBD2 Scanner Connection: The most common issue is a poor connection. Ensure the OBD2 scanner is firmly plugged into the OBD2 port. Try unplugging and replugging it to ensure a secure connection.
- Check Vehicle Compatibility: Confirm that your OBD2 scanner is compatible with your vehicle’s make, model, and year. While OBD2 is a standard, some older or non-standard vehicles might have compatibility limitations. Refer to your scanner’s compatibility list or manufacturer’s website.
- Test Scanner on Another Vehicle (if possible): If you suspect the scanner itself might be faulty, try using it on a different OBD2-compliant vehicle. If it works on another vehicle, the issue is likely with your car. If it doesn’t work on any vehicle, the scanner may be defective.
- Check Vehicle Battery Voltage: Low vehicle battery voltage can sometimes interfere with OBD2 data communication. Ensure your vehicle’s battery is adequately charged. A weak battery can cause communication errors or prevent the scanner from powering up correctly.
- Inspect ECU Fuses and Wiring: In rare cases, a blown fuse or wiring issue in the vehicle’s OBD2 system or ECU can prevent data access. Check the fuses related to the ECU and diagnostic port in your vehicle’s fuse box. Inspect the wiring around the OBD2 port for any damage.
- Sensor Malfunctions (Inaccurate Data): If you are getting live data readings that seem implausible or erratic, suspect a faulty sensor. For example, if the coolant temperature reading is -40 degrees Celsius on a warm day, the coolant temperature sensor is likely malfunctioning.
- Software Updates (Scanner and Vehicle): Ensure your OBD2 scanner’s software is up to date. Scanner manufacturers often release updates to improve compatibility, add features, and fix bugs. In some cases, vehicle ECU firmware updates can also improve diagnostic communication.
- Data Interpretation Errors: Double-check your understanding of the live data parameters and their expected ranges for your vehicle. Consult reliable repair information sources or your vehicle’s service manual to ensure you are interpreting the data correctly.
- Filter and Focus on Relevant Data: When faced with a long list of live data parameters, filter and focus on the parameters most relevant to the specific issue you are diagnosing. This helps prevent data overload and makes interpretation more efficient.
- Seek Professional Assistance: If you have exhausted basic troubleshooting steps and are still unable to read or interpret OBD2 live data effectively, don’t hesitate to seek help from a professional mechanic or diagnostic specialist. Complex issues may require advanced diagnostic tools and expertise.
By systematically following these troubleshooting tips, you can often resolve common OBD2 live data issues and get back to diagnosing your vehicle effectively.
OBD2 Live Data: A Cornerstone of Preventive Maintenance
OBD2 live data is not just for diagnosing problems; it’s also a powerful tool for preventive maintenance. Regular monitoring of live data parameters can help you proactively maintain your vehicle, prevent breakdowns, and extend its lifespan.
- Early Detection of Potential Problems: By periodically reviewing live data, you can identify subtle deviations from normal operating parameters before they trigger fault codes or noticeable symptoms. For example, gradually increasing fuel trim values over time might indicate a developing vacuum leak or fuel system issue that can be addressed before it causes driveability problems.
- Optimize Vehicle Performance and Fuel Efficiency: Monitoring parameters like oxygen sensor readings, fuel trims, and intake air temperature can help you identify and address factors that are negatively impacting fuel economy or engine performance. For example, consistently rich fuel trims might indicate a need for air filter replacement or spark plug maintenance.
- Reduce Long-Term Repair Costs: Proactive maintenance based on live data insights can help prevent minor issues from escalating into major, expensive repairs. Early detection and correction of problems can save you significant money in the long run by avoiding costly component failures and breakdowns.
- Enhance Vehicle Safety: Monitoring live data related to critical systems like brakes (ABS data, if available), engine performance, and emissions can contribute to overall vehicle safety. Ensuring these systems are functioning optimally is essential for safe driving.
- Emission System Health Monitoring: Regular checks of oxygen sensor data and catalytic converter efficiency (Mode 6 data) can help ensure your vehicle’s emission system is functioning correctly and that it will pass emissions tests.
- Streamlined Diagnostics When Issues Arise: When a problem does occur, having a history of baseline live data readings makes diagnostics faster and more efficient. You can readily compare current data to previous readings to identify what has changed and pinpoint the source of the issue more quickly.
- Promote Long-Term Vehicle Health and Longevity: Consistent preventive maintenance guided by OBD2 live data helps maintain your vehicle in optimal condition, contributing to its long-term reliability, durability, and overall lifespan.
In essence, integrating OBD2 live data monitoring into your regular vehicle maintenance routine is a smart investment. It empowers you to be a proactive vehicle owner, enhancing vehicle performance, safety, and longevity while minimizing unexpected breakdowns and repair expenses.
Boosting Performance: Enhancing Your Ride with OBD2 Live Data
Beyond diagnostics and maintenance, OBD2 live data can be a valuable tool for vehicle performance enhancement and tuning. By understanding and analyzing performance-related parameters, you can optimize various aspects of your vehicle’s operation.
- Optimize Fuel Efficiency for Economy or Performance: Analyze fuel trims and air-fuel ratios to identify areas for improvement in combustion efficiency. Adjustments to driving habits, maintenance, or even engine tuning can be guided by live data to maximize fuel economy or optimize air-fuel ratios for performance gains in specific driving conditions.
- Fine-Tune Engine Response and Power Delivery: Use throttle position, RPM, MAP, and ignition timing data to evaluate engine responsiveness and power delivery characteristics. Performance tuning adjustments to parameters like ignition timing, fuel curves, or boost pressure (for turbocharged engines) can be made based on live data feedback to achieve desired performance improvements.
- Monitor Engine Health Under Performance Conditions: When pushing your vehicle’s performance limits (e.g., during track days or spirited driving), live data monitoring of parameters like coolant temperature, oil temperature (if available), and exhaust gas temperature (EGT, if available) is crucial to prevent overheating and engine damage.
- Diagnose Performance-Related Issues: Use live data to diagnose performance problems like sluggish acceleration, hesitation, turbo lag, or misfires that may not trigger standard DTCs. Live data can help pinpoint the root cause of these issues, whether it’s related to fuel delivery, ignition, air intake, or other systems.
- Custom Engine Tuning and Calibration: For advanced users and professional tuners, OBD2 live data is indispensable for custom engine tuning and calibration. Real-time data feedback allows tuners to make precise adjustments to engine control parameters to optimize performance for specific modifications, driving styles, or fuel types.
- Enhance Transmission Efficiency and Shift Performance: In vehicles with electronically controlled automatic transmissions, live data monitoring of transmission parameters can help optimize shift points, shift firmness, and torque converter lockup for improved acceleration, fuel economy, or shift smoothness, depending on the desired outcome.
- Control and Reduce Emissions During Performance Driving (where applicable): While performance tuning often prioritizes power, live data can also be used to monitor and control emissions even under performance driving conditions. Adjustments can be made to engine parameters to minimize harmful emissions while still achieving performance goals.
- Predictive Performance Maintenance: By tracking performance-related live data parameters over time, you can identify trends that may indicate potential performance degradation or the need for specific maintenance. This proactive approach helps maintain peak performance and prevent performance-robbing issues.
In summary, OBD2 live data is a powerful enabler for enhancing vehicle performance. Whether you are aiming for better fuel economy, improved engine responsiveness, or track-ready performance, understanding and utilizing live data provides the insights needed to make informed adjustments and optimize your vehicle to its full potential.
Conclusion: Embrace the Power of OBD2 Live Data
Understanding how to read OBD2 live data is no longer just for professional mechanics. It’s a valuable and increasingly essential skill for any vehicle owner who wants to be proactive about vehicle maintenance, diagnose issues accurately, and even enhance their car’s performance. By embracing OBD2 technology and learning to interpret live data, you unlock a wealth of information about your vehicle’s inner workings, empowering you to keep it running smoothly, efficiently, and reliably for years to come. Take the time to learn, invest in a good OBD2 tool, and start exploring the real-time data your car is constantly broadcasting – you’ll be amazed at what you discover and how much it can benefit your vehicle ownership experience.